At Steeped AI, we're zealous in our pursuit of insights hidden in survey data. It illustrates our curiosity for learning, and discovery.
But what is an insight?
To us, an insight isn't just a data point or research finding. It's a Eureka! moment, a burst of clarity that reveals something unexpected, maybe even game-changing. Insights feel exciting. They often spark more questions, and sometimes, they change an entire direction. That's what makes them valuable.
Surveys are a powerful tool for collecting various types of data, with the goal of better understanding the general population. But raw data alone isn't enough. Statistical analysis is what transforms that data into meaningful, generalizable insights.
Why Stats are Mandatory for Survey Analysis
Statistical analysis isn't just helpful, it's essential. It allows us to infer from a sample to the broader population with confidence. Beyond generalization, it also helps us identify relationships, make comparisons, and, critically, control for bias and error that can arise throughout the research process.
While sample size is commonly recognized as important for reducing the margin of error, many other sources of bias and error also need to be addressed in any sound analysis. Here are just a few:
- Response Bias: errors in the way that the respondents answer. Example: answering randomly, doing the minimum to get through the survey, extreme responding.
- Recall Bias: Individuals don't always accurately remember past events or behaviors.
- Social Desirability Bias: Even in anonymous surveys, people may answer in ways that they perceive as socially acceptable rather than truthfully.
- Acquiescence Bias: The tendency to agree with statements especially in agree-disagree format.
- Sampling Bias: When a sample isn't representative of the population the researcher is studying.
- Self-Selection Bias: Individuals with strong opinions or limited financial means are more likely to participate, especially in opt-in or pay-for-completes incentivized surveys.
- Undercoverage/Non-sampling Bias: When certain groups are left out entirely (eg. elderly individuals are often not represented in online surveys).
- Question Design Bias: Poorly worded or leading questions can unintentionally influence responses and skew results.
- Administrative and Technical Errors: Programming mistakes, data entry issues, or technical glitches can also distort results.
These just scratch the surface. Research isn't a perfect science, and we embrace that reality. That's why we've developed a three-part statistical analysis procedure that we apply to all our survey findings to help filter out noise and highlight what's truly significant.
- We start with the best-fit inferential statistical test based on the data type.
- If a result is statistically significant, we follow up with a pairwise comparison to filter down further.
- Finally, we apply a Benjamini-Hochberg correction in post hoc analysis to control for false discovery.
Only when a finding passes all three steps do we label it as statistically significant—or "stat sig” in our user interface.
What is Statistical Significance in Survey Analysis?
Statistical analysis, specifically inferential statistics, helps us distinguish between patterns that are meaningful and those that are just noise.
When analyzing survey results, we often see numerical differences between groups: maybe more women than men agree with a certain statement, or older respondents answer differently than younger ones. But are these differences real, or could they just be due to random variation in who happened to take the survey?
That's where statistical significance testing comes in. It helps us evaluate whether a difference is likely to be due to chance or whether there's evidence of a real, underlying effect in the population we're studying.
In simple terms: statistical significance tells us how confident we can be that a pattern is worth paying attention to.
What Statistical Significance Can't Tell Us
Like any tool, statistical significance has limits.
Even with rigorous analysis, we can never be 100% certain that a relationship between variables is real. There are always sources of error, sampling issues, bias, measurement errors, and more. And even when a statistically significant difference exists, it doesn't mean one variable caused the other to change.
Also, statistical significance does not equal importance. A finding can be statistically significant but practically irrelevant. Or it can be statistically insignificant, but still worth exploring because it speaks to a trend, story, or question that matters.
That's why statistical analysis is just one part of our larger process. It's a filter, a way to reduce noise and surface the signals that deserve a closer look. But it's only one layer of what makes an insight valuable. That's why Stats Score is only one part of our broader Eureka Score.
Real Survey Examples of Why Stats Matter
Let's look at a real-world example that shows how statistical analysis can move us closer to insight.
In a 2022 Pew Research Center Study with a question of gender perceptions in the workplace, researchers found that:
- 55% of men said it's become harder for men to know how to interact with women at work over the last five years.
- 39% of women said the same.
This difference is statistically significant, it's not just a coincidence of the sample. It points to a meaningful divergence in perception based on gender.
While this doesn't prove causality, it gives us a starting point. A statistical difference opens the door to deeper investigation and maybe to a new insight.
When Metrics Look Different but Aren't Stat Sig
The same survey also asked the question, “Should dating apps require background checks?”. Below are the results for the demographic of religious identity.
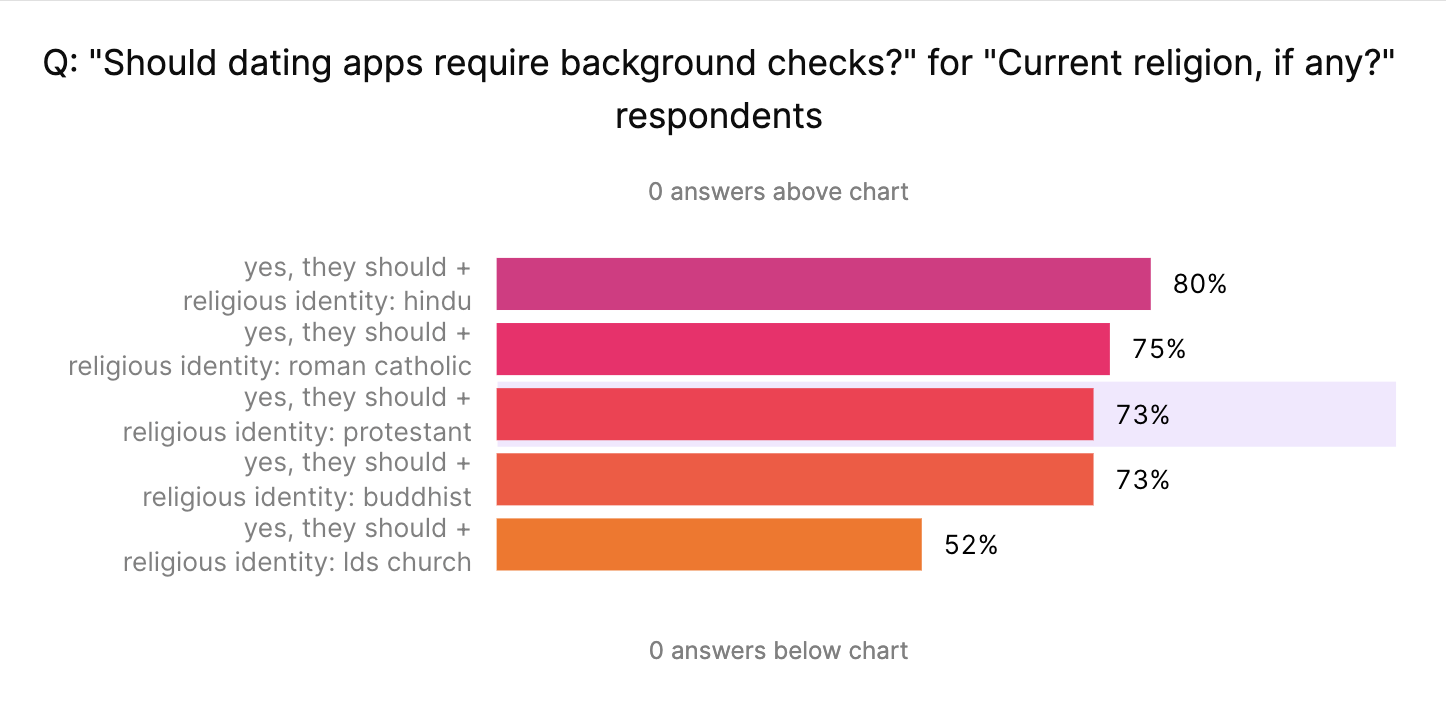
At first glance, this 7% difference might seem like an important difference. We might be tempted to say: "Hindu individuals are more likely to support background checks on dating apps than Protestant individuals."
But when we run the statistical test, we find the difference isn't statistically significant—because the sample size is small and there's variability in how people answered. Based on the data we have, that 7% gap could easily be due to random variation rather than a real difference in experience.
What does that mean?
It means we can't say Hindu individuals are more likely to support background checks on dating apps than Protestant individuals, at least not from this dataset. It also means that if we had just posted the above graph or metrics it would be misleading.
Why We Care
At Steeped AI, we're committed to using rigorous statistical methods not just because they're academically sound, but because they help us uncover meaningful insights, those Eureka! moments that spark action, learning, and curiosity. We've developed a standardized 3-part statistical testing method that is applied to all of our findings specifically to reduce bias and error. If you want to know more information about our specific statistical analysis method, Book a Demo of our Product Now!
To learn more about how our platform surfaces insights using the Eureka Score, check out our article: AI and Survey Analysis: Lessons from Ranking Millions of Insights.
Behind the product is a passionate team always learning, always iterating, and always aiming to build tools that delight our clients and spark better questions.