
Over the past 18 months, Steeped AI's COO, Tanisha Falat, and I have used AI to rank millions of survey insights. We calculated all the demo breakout shares (crosstabs) for thousands of questions in massive open sourced surveys like BJS National Crime Victimization Survey (240,000+ respondents), Canadian Census Internet Use Survey (25,000+ respondents), Pew Research Center Datasets like this one (6,000+ respondents) and many more. We used AI, ML and advanced statistics to rank for compelling insights that have impact with varying results and a lot of curveballs. After months of trial, error and refinement, we developed a method and ranking system called the "Eureka Score." It ranks hidden, surprising, relevant and interesting insights at the top, regardless of the survey.
Our Goal: Surfacing Insights that are “Diamonds in the Rough”
Our goal for ranking insights was to surface insights that are novel, easy to miss and also have real impact potential. The type of insight where “you know it when you see it,” and you instantly want to share. An insight that tells a compelling story, resonates with most people, and gets to the heart of the matter while also being surprising, inspiring new growth opportunities.
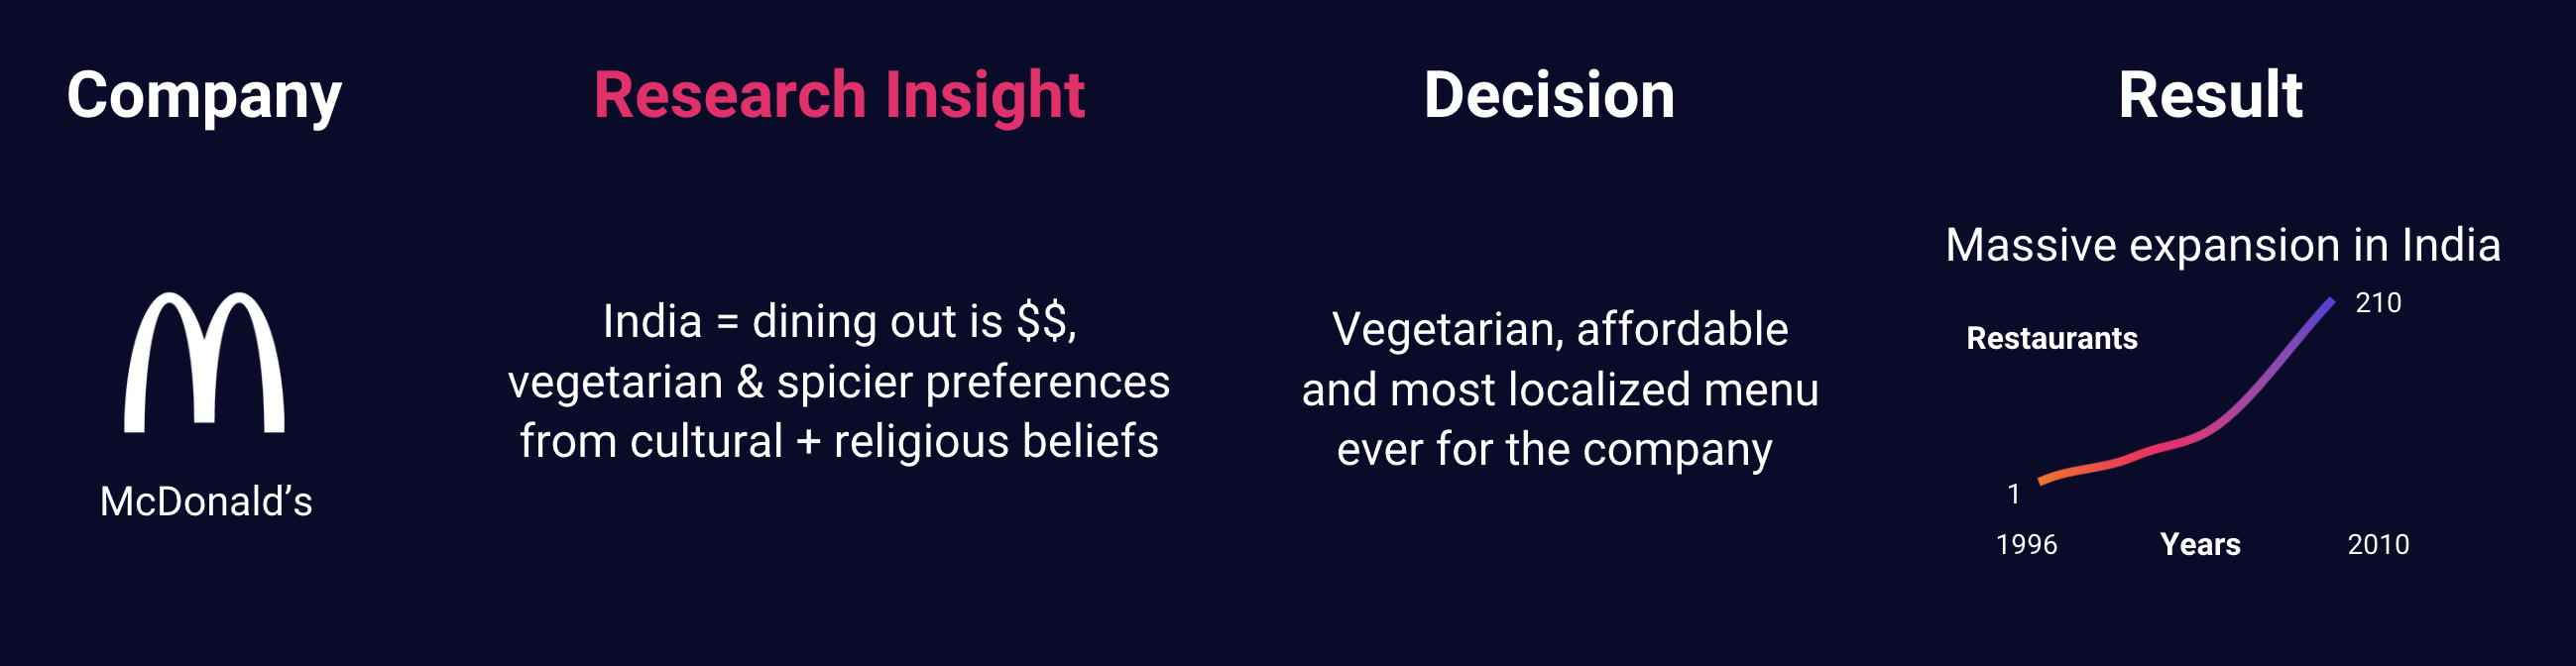
A great example of these types of game-changing insights is when McDonalds, famous for their beef burger, used a research-based approach as they tried expanding into India in 1996. McDonald's carefully considered key insights from their research, recognizing that many Indians are vegetarian, prefer spicier flavors, and view dining out as a luxury due to cultural and religious traditions. As a result, McDonalds made the most localized menu ever for India and made it very affordable. McDonalds was a hit in India and they expanded to 210 restaurants in the country by 2010.
In the research community, these transformative insights have had many names: the “the diamond in the rough,” the “moment of truth,” the “so what” or “aha moments.” Historically, these insights have been extremely time and labor intensive to find. But what if instead of digging for weeks through crosstabs, a ranking process sorted for compelling insights automatically? That's what we set out to build - and we named the project “Eureka Score”.
Immediate Problems: These Aren't Simple Concepts and Insight Quantity is Overwhelming
As we started to build the Eureka Score rankings, a lot of problems immediately started to surface:
- Subjectivity: Right off the bat, concepts like “compelling” and “surprising” are subjective and hard to definitively quantify. People vary widely on what they consider compelling based on their different experiences and preferences.
- Insight Quantity: When you do crosstab breakouts of survey insights, the quantities are immense. For example, for the Pew Research Center Survey, there were 40,000+ different crosstab insights to choose from. That's a lot of candidates for compelling insights that we could miss.
- One Concept is Not Enough: Even with a perfect scoring system for a concept like “surprising,” relying solely on that metric would overlook other insights that, while not surprising, are highly relevant to a researcher's goal.
- AI is inconsistent: Even with the best prompt and custom parameters, most LLMs still give inconsistent results from time to time, making it hard to standardize. Depending on your prompt, if you asked it to classify a score with the same exact content, that score typically shifts within a range randomly.
Trial and Error: AI Is the Way to Go, but There Were Still Issues
We completed months of research, repeated testing and tried different tech to get at Eureka Score. Here's how we did it:
Agreeing on Subscore Concepts to Test: To combat the subjectivity issue, we agreed to test out “subscores” that we could later weight and combine for our Eureka Score. After partnering with Twocents Insights on this qual and quant research for data professionals we came up with 5-10 popular subscores that seemed consistent among data professionals. Examples of subscores we tested were “next_steps_score” (likely to lead to next steps), “relevance_score” (relevant to researcher goals), “metrics_score” (favorable metrics like sample and share), and “surprising_score.”
Testing Non-AI, More Scaled Solutions: Most AI APIs aren't free, and with the cheaper plans, there are limits on scale. Running AI APIs for thousands of rows of data per second, like I was used to with ML libraries at Google, is currently rare and expensive. That, combined with inconsistent results, led me to explore non-AI options first for certain concepts. For relevance, I tried building a map of interconnected broader concepts from the Wikidata API. When that had low quality results, I tried a similar concept but a more semantic and vectored-based approach for degrees of relevance with the Datamuse API and spaCy Similarity. For many subscores, we went as far as creating hundreds of good and bad examples as training data to train Tensorflow ML models. For the Metrics Scores and Stat Scores, we did a more nuanced algorithm based version of effect size to highlight insights with favorable metrics and statistics. Other than the Metrics Scores and Stat Scores, AI had higher quality results for the rest of the subscores for ranking insights. For me, this was a watershed moment of where we are in the AI boom for research. It's a pretty exciting time!
Testing Different AI: Six months ago, we tested out our AI subscores on a variety of AI LLMs including OpenAI's ChatGPT, Google's Gemini, Antropic's Claude, Meta's Llama and Perplexity. We eventually landed on ChatGPT for Eureka Score production (specifically model 4o), but we are still experimenting with other LLMs including Deepseek.
Knowing When To Give Up: In refining subscores, their relevance and the techniques to calculate them, we discovered the importance of knowing when to walk away from unproductive efforts. For instance, we found that 'next_steps_score' was too subjective even for AI, making it one of the most inconsistent subscores. As a result, we decided to remove it from the Eureka Score.
Combining AI with Other Methods to Standardize: Without revealing too much of Steeped AI's secret sauce, we developed pre- and post-AI methods to scale and standardize scores across an entire survey.
The Goldilocks Zone: The Solution We Landed On for Eureka Score
After a year and a half of strategizing and testing Eureka Score, here are the subscores we landed on. How we weighted, scaled, combined and standardized the scores is a secret in Steeped AI's private codebase.
- Relevance Score: Based on the insight's relevance to a “relevance statement” we ask of all our clients.
- Metrics/ Stats Score: How favorable the core metrics and stat/ regression results are for the insight.
- Surprising Score: How surprising an insight is to a researcher.
- Trending Score: Likelihood that the insight's topic would be trending in the news.
Why Eureka Score Rocks: Examples of Diamonds in the Rough
We are always improving Eureka Score, but its current iteration is pretty exciting. I haven't seen anything like it. There are a few immediate and valuable benefits that we noticed with survey insights:
- Good Stuff On Top: If you are looking at the full set of survey insights or filtering for a certain question or topic, there are always surprising and novel insights that bubble to the top.
- Mixed Variety as You Scroll: There is a variety of different types of survey insights as you scroll because Eureka Score is a combination of subscores.
- Aggregating the Score: The Eureka Score is calculated at the answer level, but it can also be averaged at the question level to reveal compelling questions, or even compelling question clusters for higher level analysis.
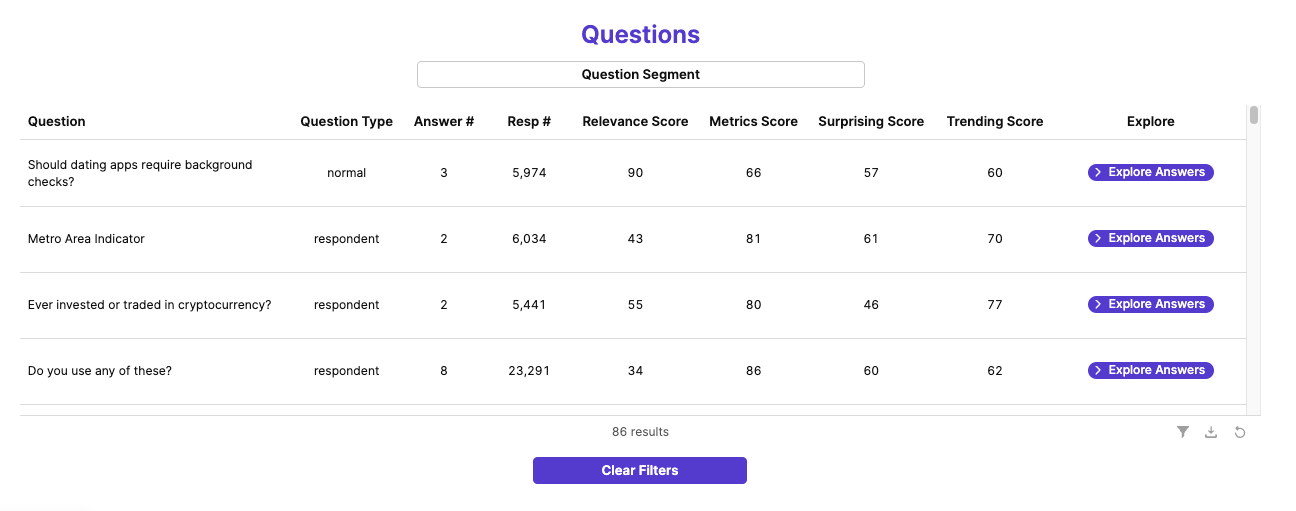
- Separate Subscore Sorting: To ensure you don't miss anything, you can sort by the separate subscores like Relevance Score and Surprising Score to see top performing insights for each subscore.
But don't take my word for it, here are some top scored insights from a variety of surveys:
86% of non-citizens in the U.S. said dating apps should require background checks before you can create a profile. (Pew Research Center Survey)
- When we saw this a “!” went above our heads. While it might be surprising to some folks (especially anyone who consumes US news), it also immediately evokes empathy for the demographic being questioned. There's an implicit fear in wanting background checks for dating apps, and finding out more to this insight would be interesting research to explore.
96% of "Very Good Mental Health" respondents said they didn't limit their internet use over the past year. (Canadian Census Internet Use Survey)
- Another noteworthy one, especially with ongoing discussions about the relationship between mental health and screen time. It raises important questions for further exploration: Do individuals with very good mental health use the internet less overall, reducing the need for limitations? Or are those who experience strong mental well-being more likely to be able to balance internet use without having to set restrictions?
64% of married respondents said it's been harder for men to know how to interact with women in the workplace over the last 5 years. (Pew Research Center Survey)
- This insight is also begging us to do more digging. The question was checking into beliefs around the “Me Too” movement years later. Why do a majority of married respondents still think men have it hard when knowing how to interact with women in the workplace? Is it because married respondents are more aware or sensitive to “Me Too” beliefs? Are they less trustful of men in the workplace more broadly?
21% of 15-24 year old respondents said they have seen content that may incite hate or violence online every day in the last year. (Canadian Census Internet Use Survey)
- If there was an “urgency score,” this one would definitely fit that bill. Why are these unfortunate young Canadians being subject to hateful and violent content online? Is this a known phenomenon? Notice how the share metric is low but this insight still bubbled to the top, and I'm glad it did. It's an important insight to understand.
Gimme More Eureka Score
This is just the tip of the iceberg in terms of Eureka Score and using AI to find survey insights. Follow us on LinkedIn to stay tuned for future deep dive articles into each subscore of Eureka Score and more insight examples.
Additionally, if you don't have a year and a half to experiment and overcome AI ranking roadblocks like we did, you can see Eureka Score in action and give us feedback live by booking a Steeped AI demo.