This round, we completed a Steeped Dive on the National UFO Reporting Center's Tier 1 UFO sightings data. The organization describes Tier 1 sightings as “The most dramatic sightings - strange structured craft or highly anomalous phenomena seen at close distance.” Regardless of where you stand on the existence of aliens, analyzing reports of mysterious, unexplained flying objects that people felt compelled to document proved fascinating.
After cleaning and de-duping the data, there were 1,551 UFO sightings with decent samples from 1950 to present.
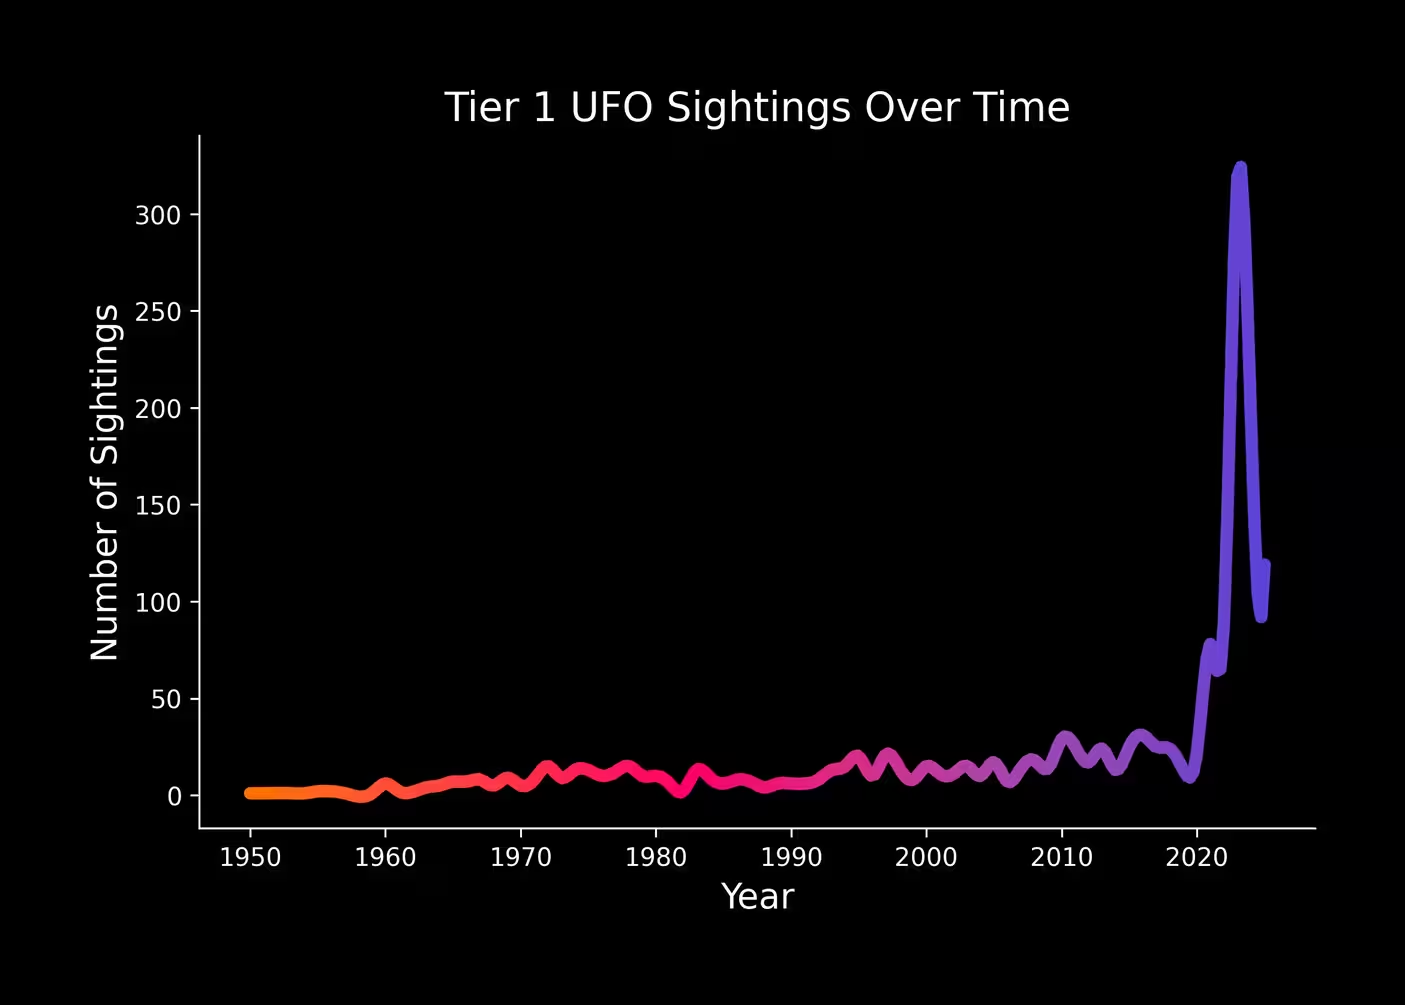
There was a big spike in the 2020s. I suspect this has something to do with recency bias and NUFORC saying that “reports received prior to March 2023 have not yet been graded.” We kept that bias in mind during our Steeped analysis.
More Tier 1 UFO Sighting Context
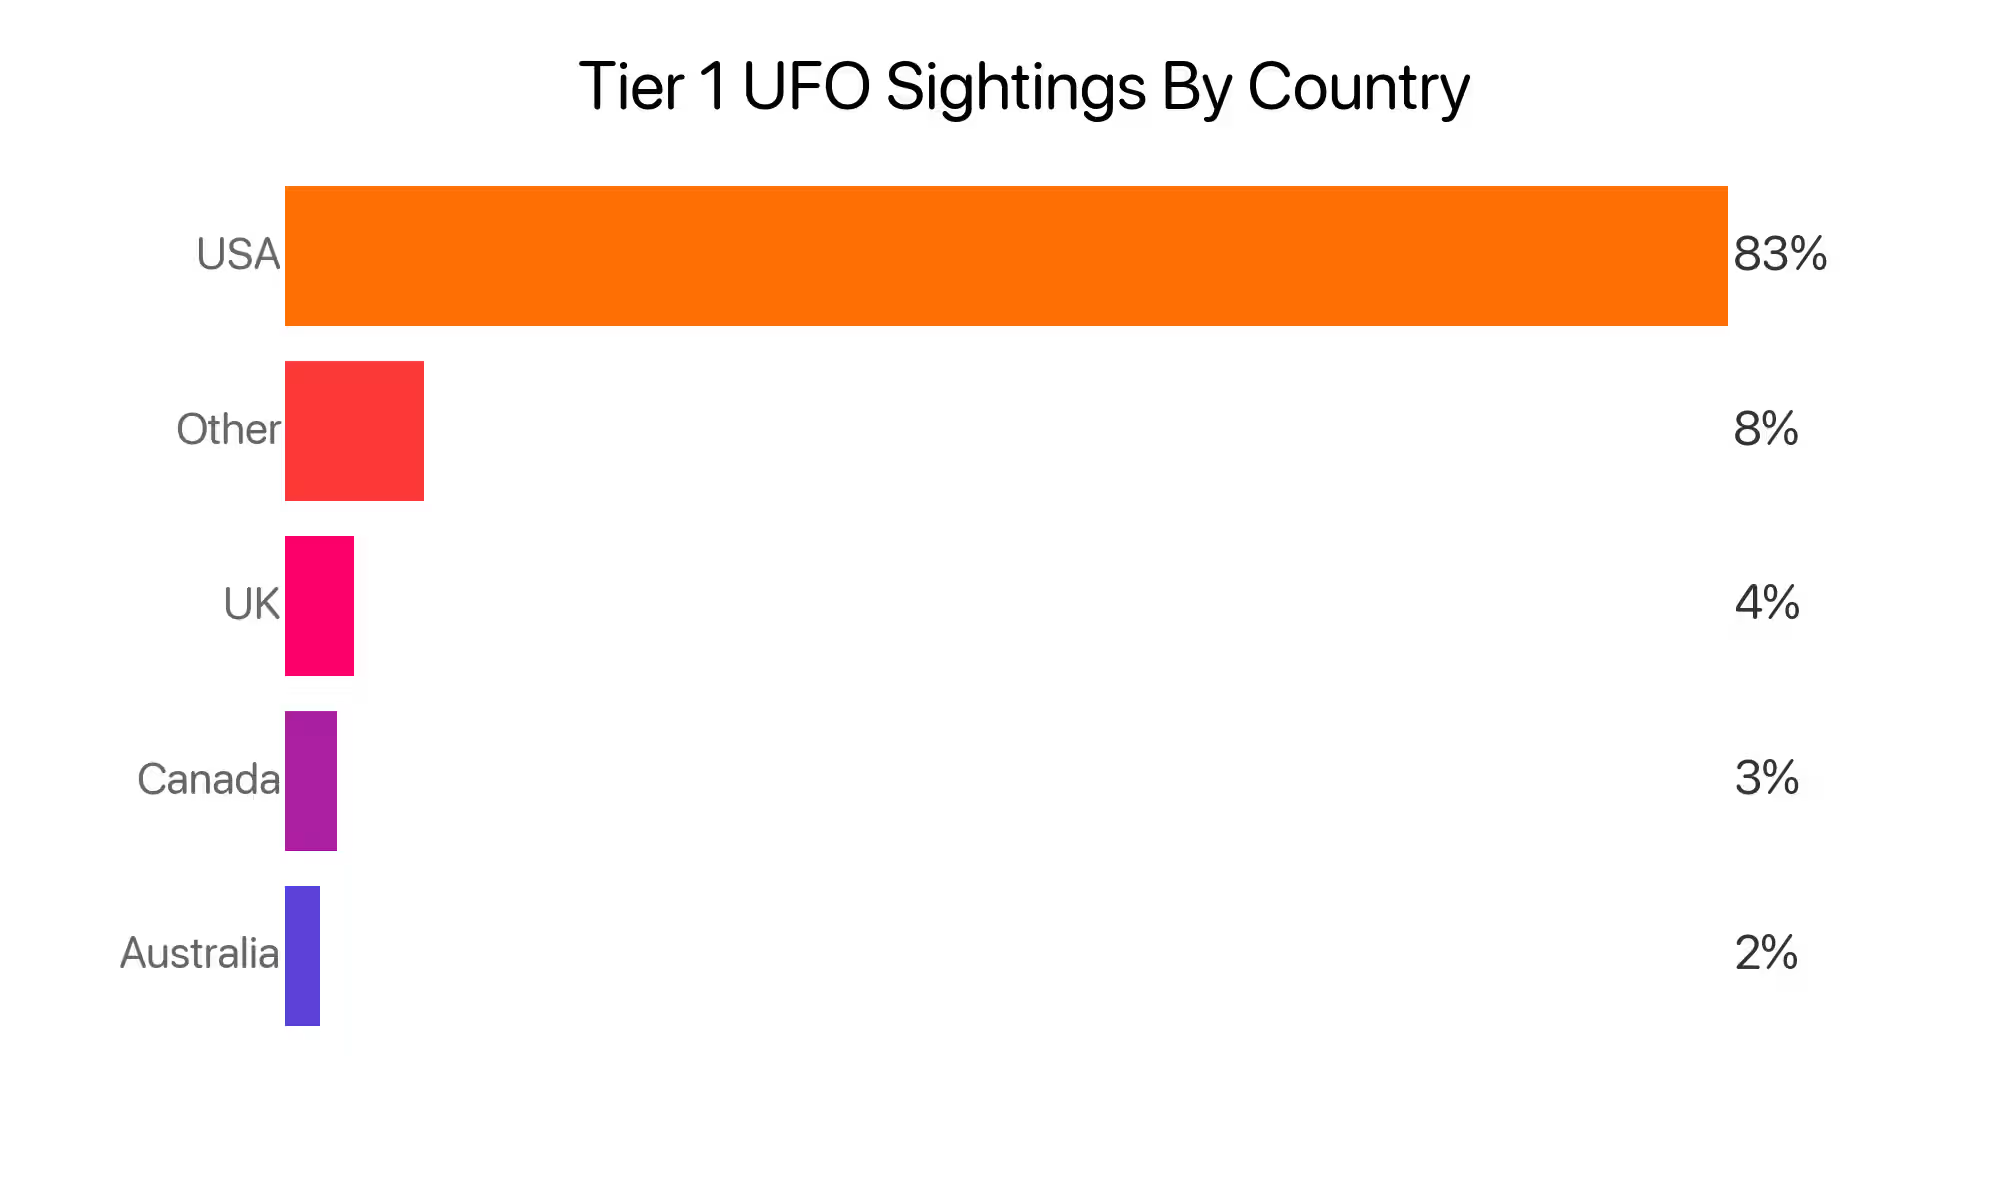
As the “National” in NUFORC suggests, these sightings were heavily skewed towards the US as 83% of sightings with countries reported were from there.
Within the US, the sightings were pretty distributed across states, with the top state being California with 9% of US findings.
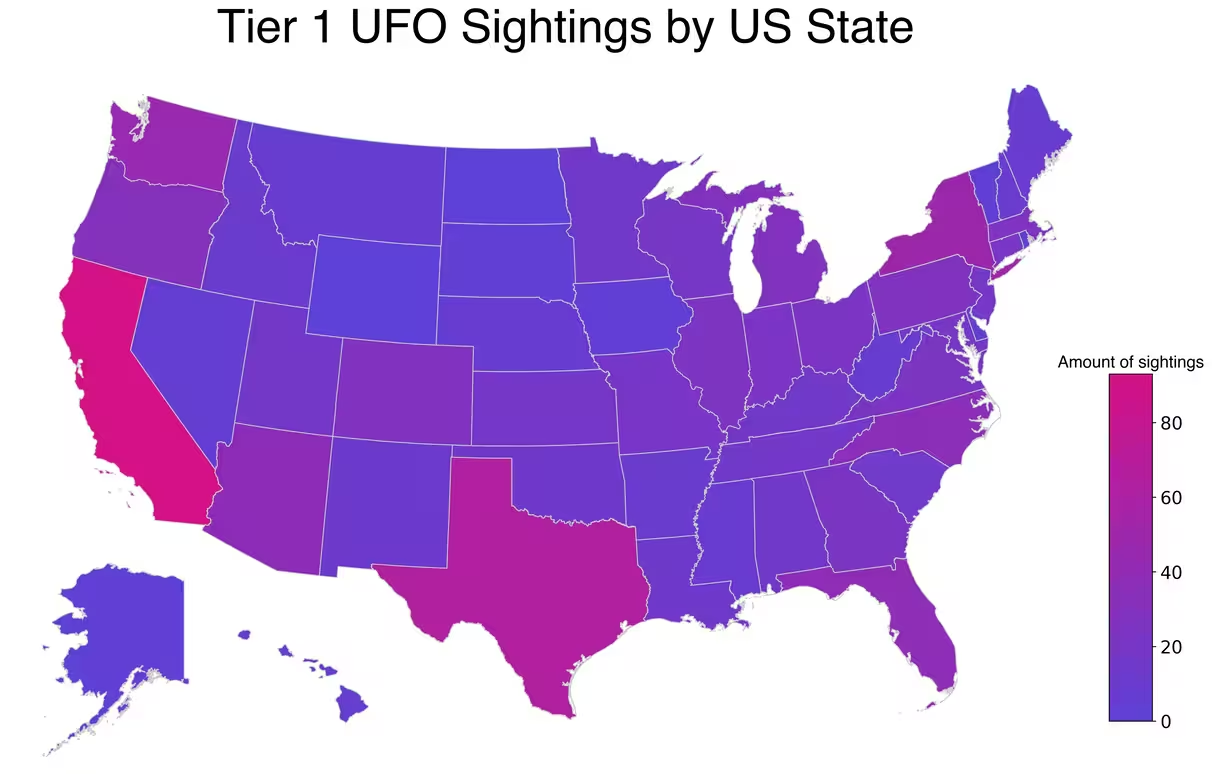
California's sightings were older, with over half happening before 2020. The top UFO shape in Oregon (29%), Colorado (28%) and California (24%) was a circle / orb. In Pennsylvania (29%), Florida (28%) and Texas (27%) the top shape was a triangle, and in New York the top shape was a disk (20%).
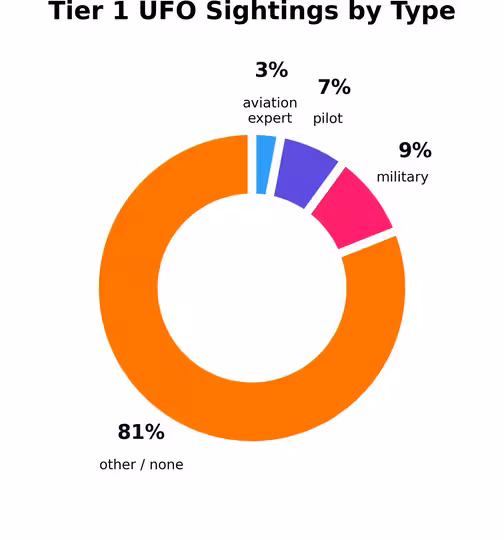
Military sightings most often described silver or gray objects (28%) with a circular or orb-like shape (22%) and an average estimated size of 167 feet. Pilot sightings, by contrast, most commonly reported white objects (32%) with a light-like shape (28%).
Investigating the U in UFO
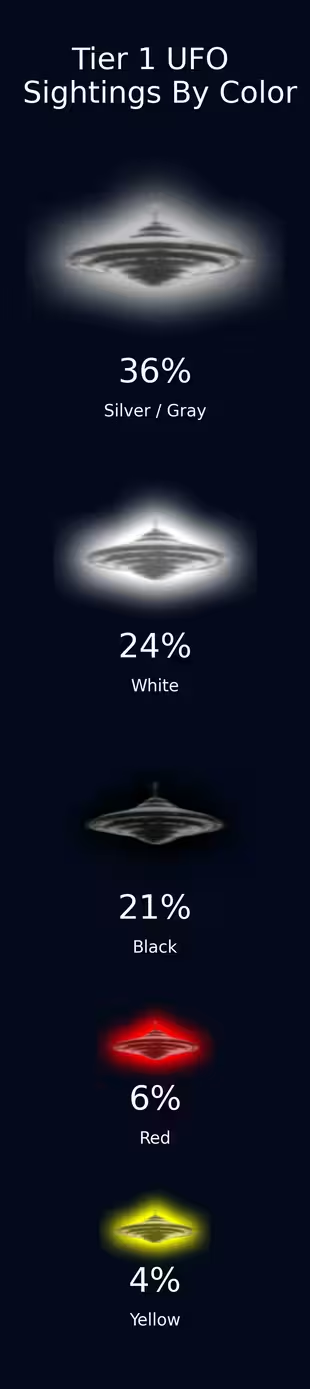
When looking closer at the reported colors in the sightings, we found that 81% of UFOs lacked color and were either silver, white or black, with silver leading the pack at 36%. A vast majority of gray and black UFO sightings were viewed from land (97% and 96%). The 7 blue sightings with estimated speeds had an average speed of 660 mph.
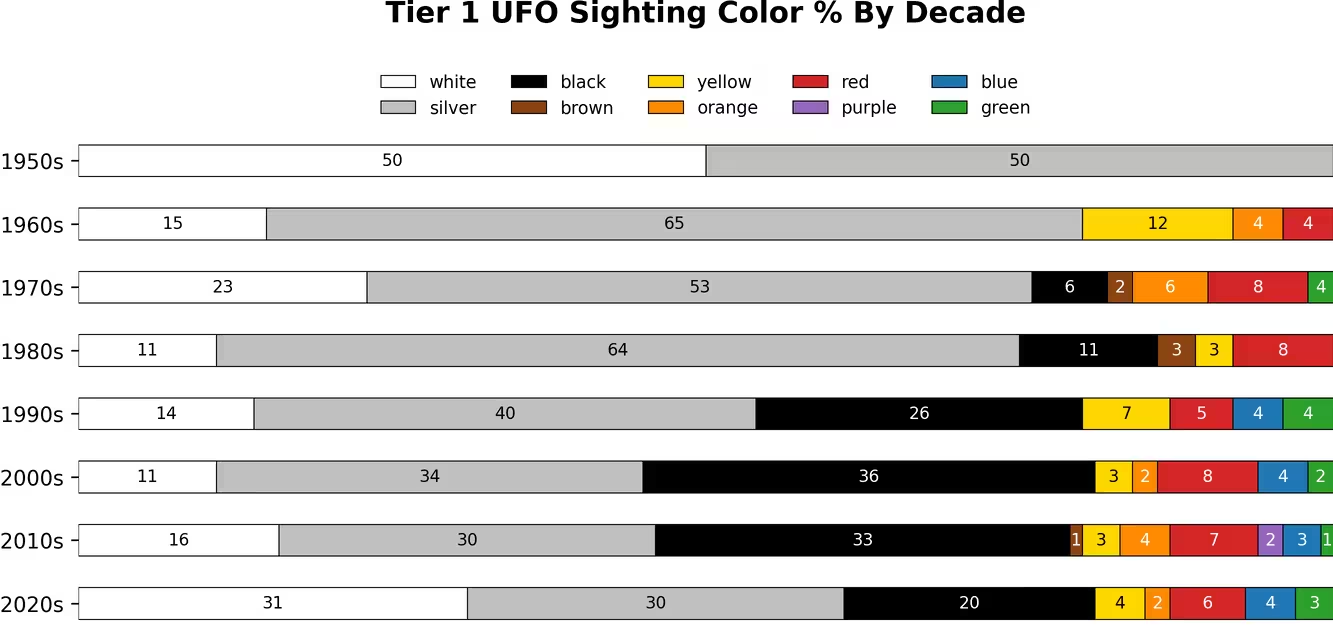
Looking at color proportions by decade, UFO reports became noticeably more colorful over time, though earlier decades have smaller sample sizes. The biggest shift seems to be the decrease of gray and the increase of black and white sightings. In fact, the 2020s account for 70% of the white UFO sightings. The increase is likely driven by aircraft-related sightings, as white accounts for the largest share of reported aircraft colors. White sightings had an average estimated speed of 224 mph and an average size of a striking 1,182 feet.
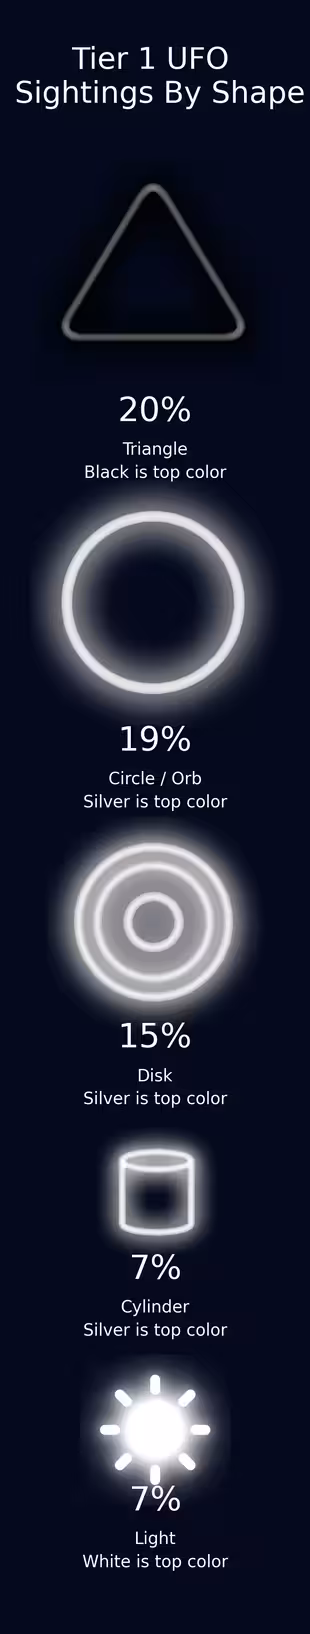
Then there's the shapes. The top shape is a triangle, surprisingly, at 20%. The fact that most triangle sightings are black (30% of triangles) and from the US (68%) makes me hypothesize that at least some of those sightings are this US Nighthawk Jet I was obsessed with as a kid.
Cylinder-shaped objects had a large average estimated size of 1,468 feet and an average speed of 174 mph, while circular objects had the highest average observer count at 42.
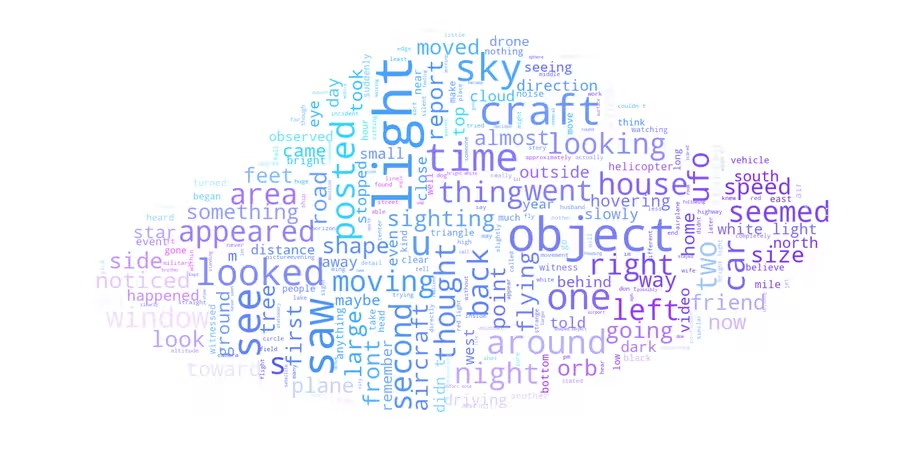
An analysis of the most frequent phrases in the detailed narratives shows that saw appears 965 times, underscoring the firsthand nature of the data. Mentions of lights and light total 1,753, while sky, object, craft, and sound each appear more than 500 times.
Explore the data yourself!
If you found this data as fascinating as I did, download these CSVs and then upload them into your very own AI Analysis Smart Sheet to discover new insights.