After two and a half years obsessing over how to make AI-driven data analysis truly accurate, effective, and accessible, we decided it was time to test Steeped AI the only way that mattered: head-to-head with ChatGPT.
This is a direct comparison of uploading the same data to the free version of ChatGPT vs Steeped AI's free Super Sheet.
- Disclaimer: While advanced models like GPT-5.2 Pro might offer better spreadsheet analysis, we chose to focus on a free-tier comparison.
- Super Sheet Tech: The Analysis Super Sheet does the heavy lifting first: 80% deep, holistic calculations delivered straight into Google Sheets. The final 20% turns those numbers into narrative-clear insights and a sharp "So What" summary powered by the Gemini API.
- The Data: The shared uploaded data was Steeped AI's site traffic from Google Analytics for the last 3 months at the time of downloading (late Jan 2026). The CSV contained a good mix of categorical (Device category, Page Title, Page Referrer, Region etc) and numerical data types (Sessions, Engagement Rate, Average Session Duration) essential for understanding site behavior.
- The Problem: The problem we wanted to solve with AI analysis is pretty typical of any startup. We wanted to understand the key trends and impactful insights behind our recent campaign to promote the Super Sheet (formally known as the Smart Sheet).
- The Prompt: Our main goal was to drive growth. When we uploaded the data to both AI platforms the prompt was: "Attached is Google analytics for a startup that recently launched a free 'smart sheet'. Priority column is engagement rate. Give insights that show growth opportunities."
ChatGPT Weaknesses
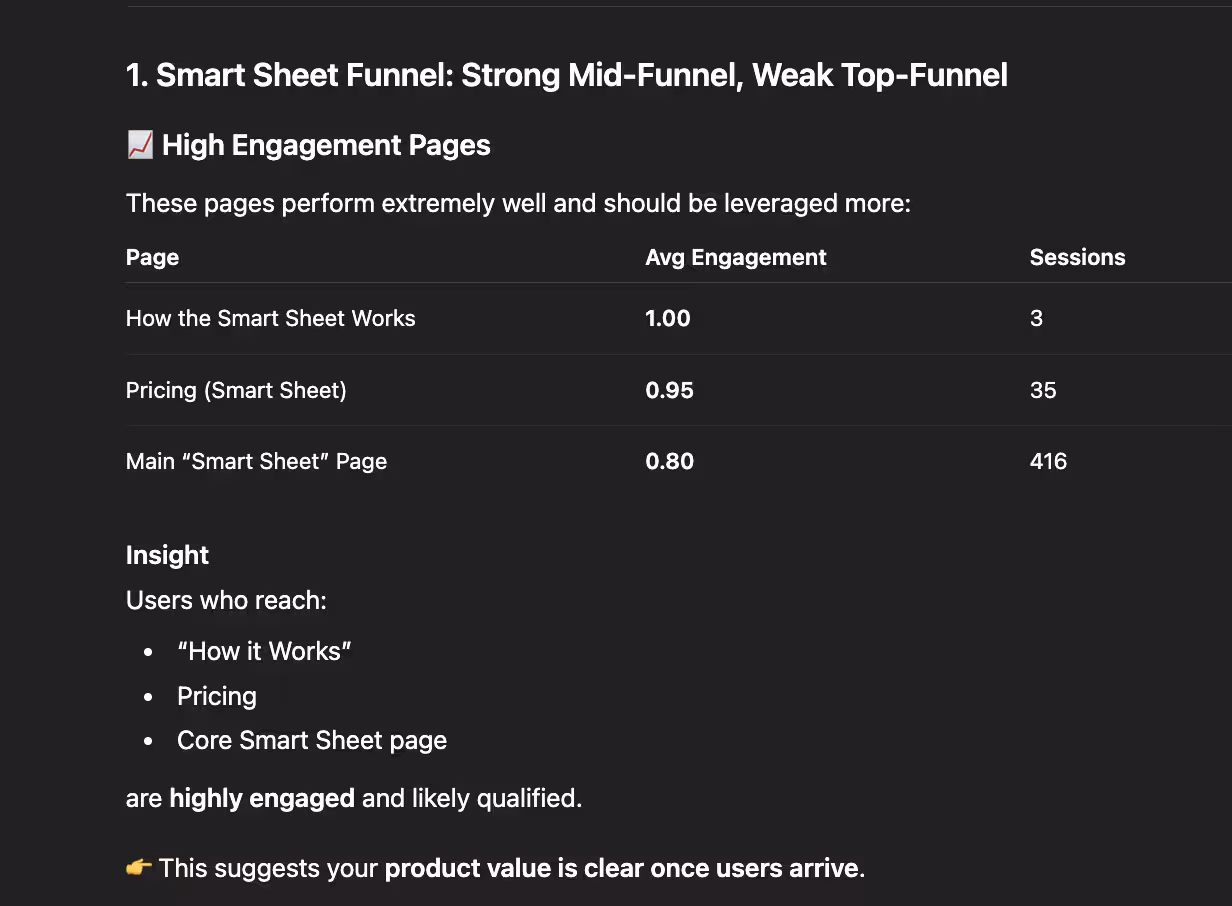
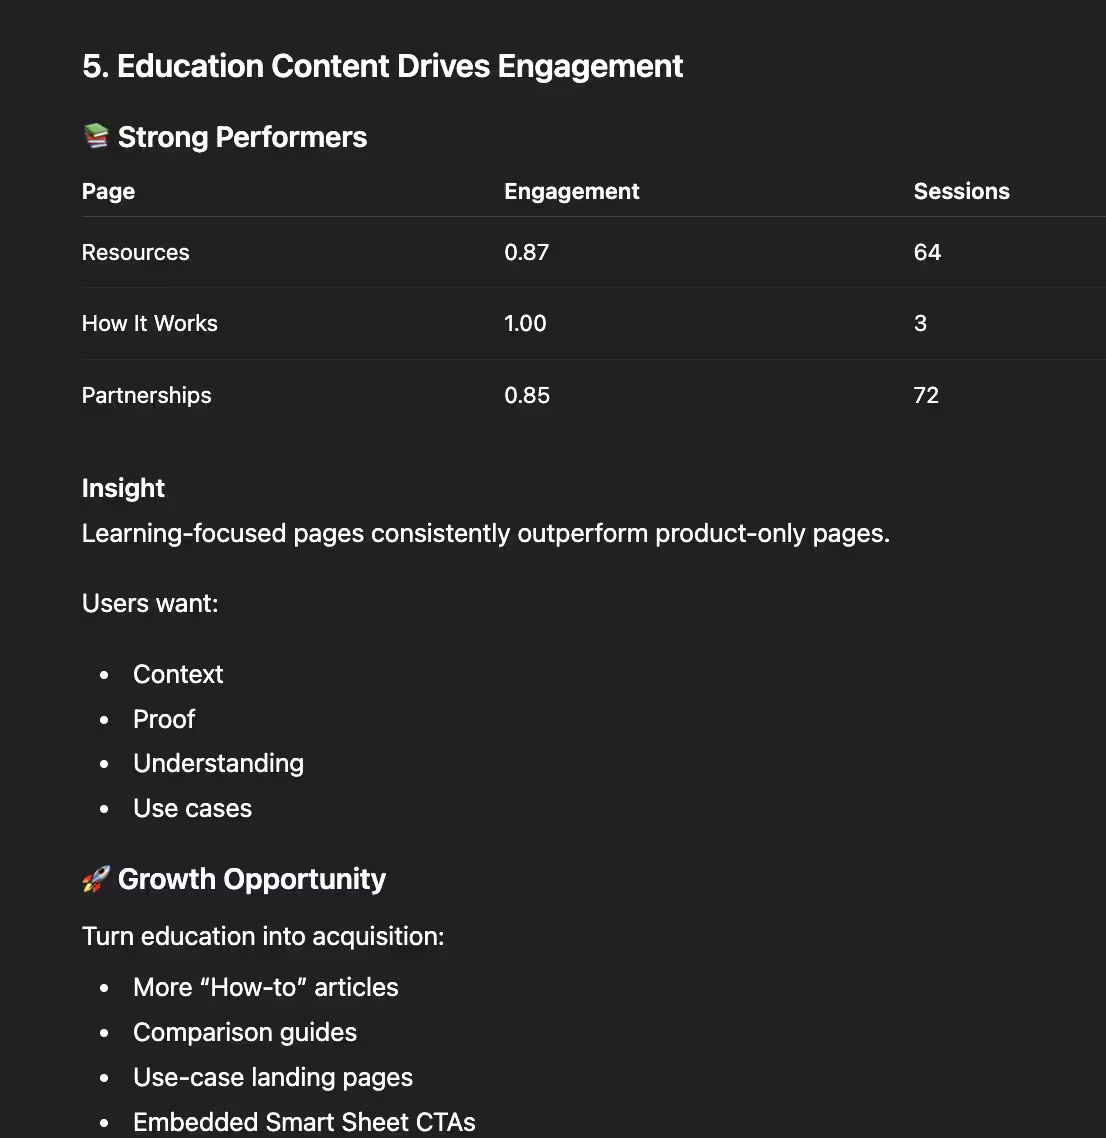
ChatGPT's first recommendation revealed a significant analytical oversight. It identified our "How the Smart Sheet Works" and "Smart Sheet Pricing" pages as high-engagement areas, suggesting "This suggests your product value is clear once users arrive." However, the analysis ignored session volume. For example, the "How the Smart Sheet Works" page had only three sessions. Drawing broad conclusions from such a small sample size is statistically unsound and creates a misleading picture of the user journey.
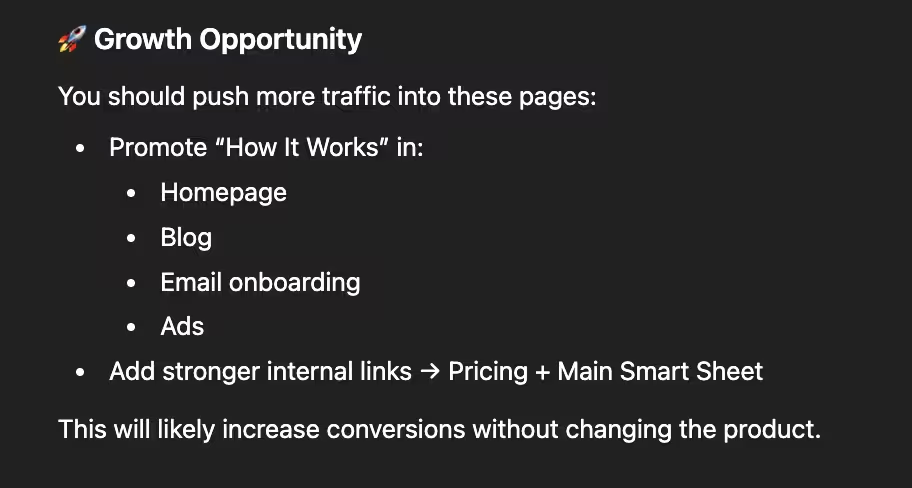
Most, if not all three sessions on "How the Smart Sheet Works" were most likely us as we were developing the page! With a quick manual filter, it is clear that all 3 sessions are in Texas (our current HQ) and very recent. Knowing that, the “Growth Opportunity” suggestion of sharing that page everywhere to receive more conversions feels a little hollow and misleading. As a time-strapped founder, I'm focused on maximizing leverage and time. Recommending such a strong next step based on a minimal effect size felt misaligned and could lead to wasted time.
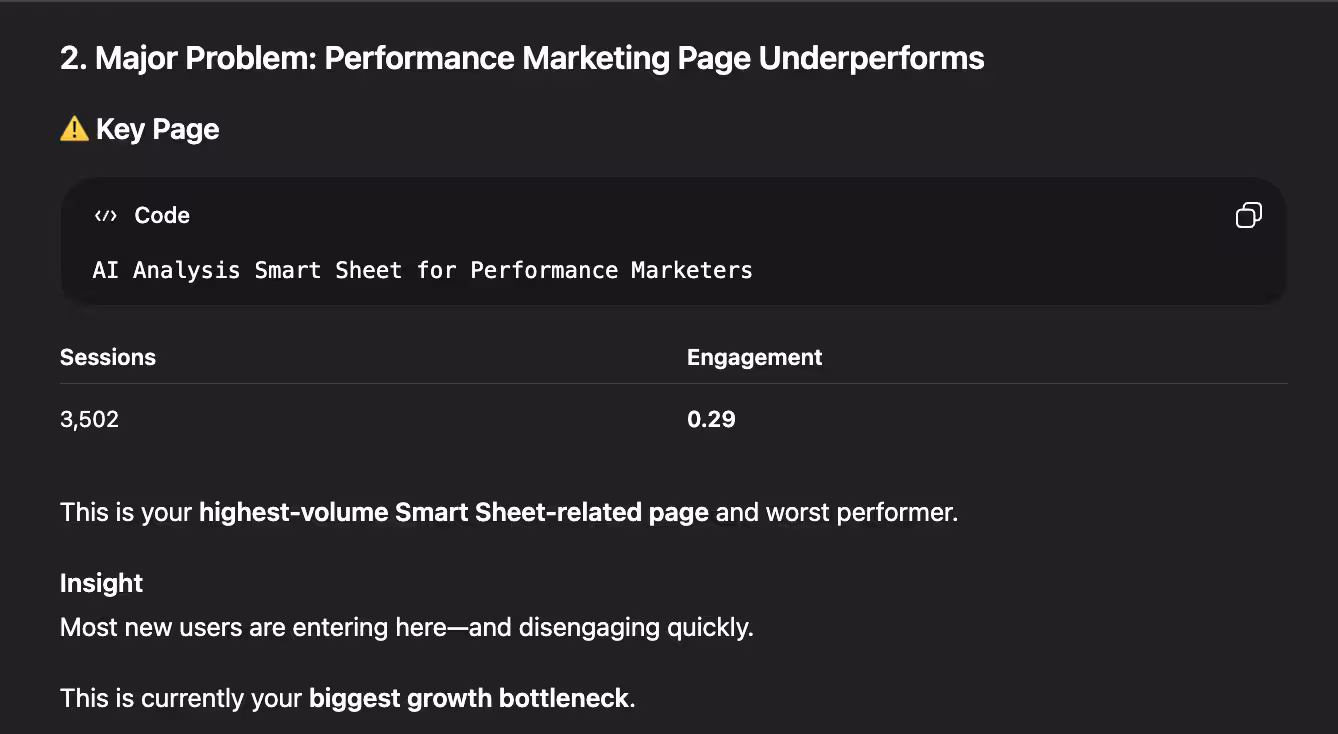
While ChatGPT correctly identified our "Smart Sheet" landing page as a high-traffic, low-engagement area, its analysis lacked depth. By failing to account for the traffic source, a paid Meta Ads campaign, the AI missed the "why" behind the numbers. Because it ignored the referral data, its suggestions were generic. It recommended UI improvements we had already implemented, rather than addressing the specific behavior of "cold" audiences arriving from social media.
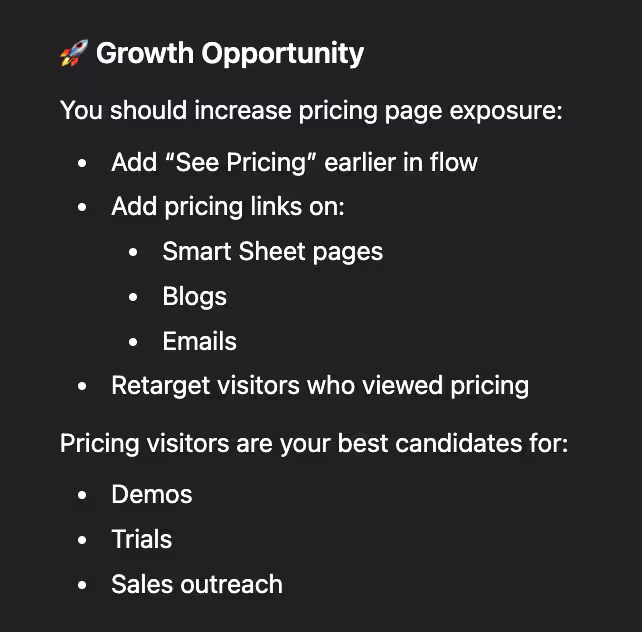
In its fourth suggestion, ChatGPT doubled down on the pricing pages once again. While the engagement data there is strong, the strategy feels misaligned with the user journey: directing someone already on a pricing page to "try a free product" is often redundant. Furthermore, the delivery relied on overused AI tropes (like the word "gold") which can make automated insights feel more like a template than a tailored strategy.
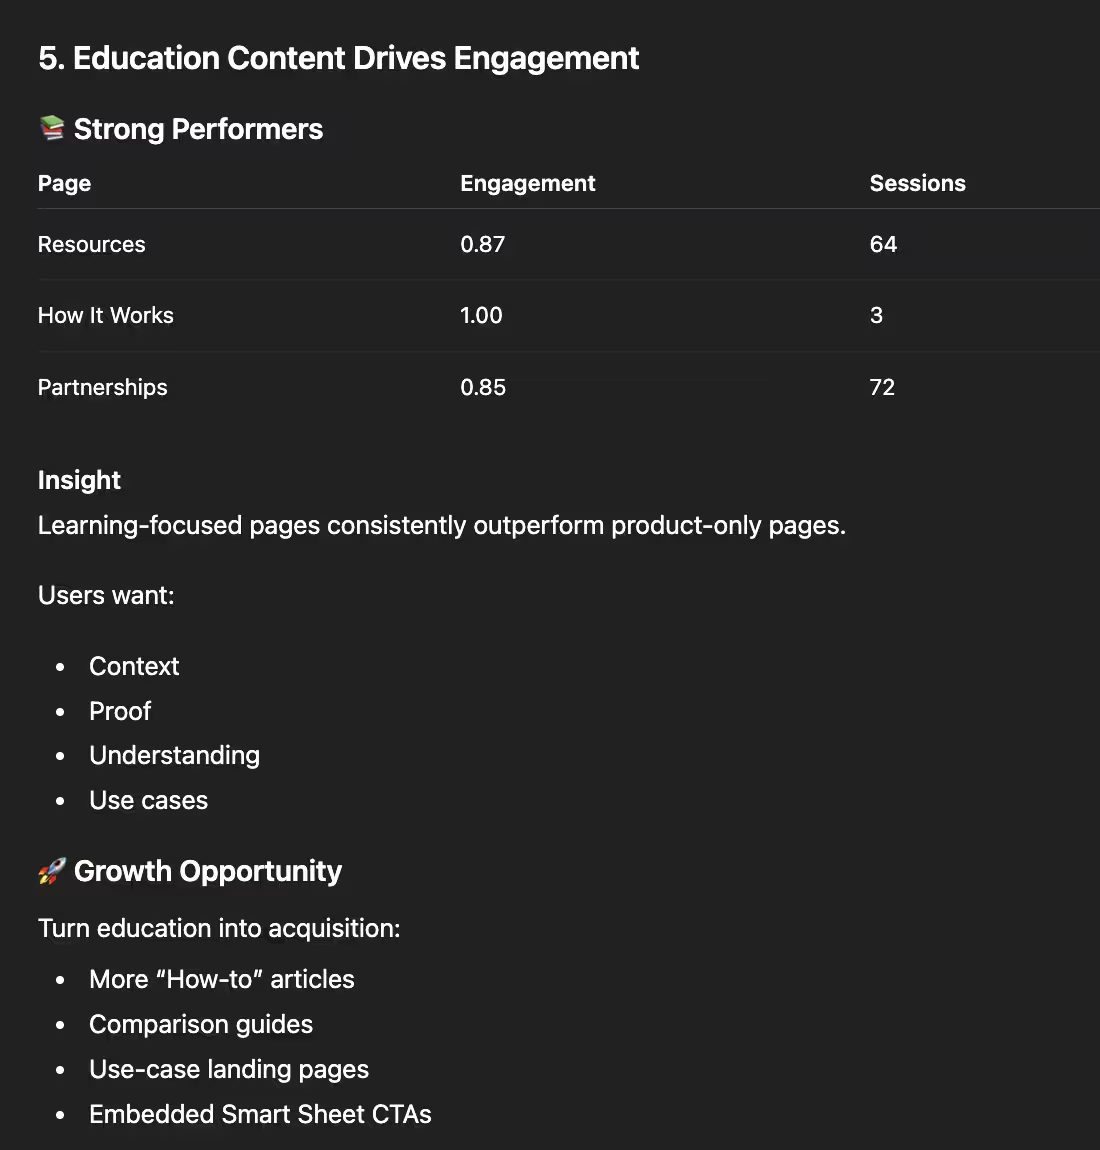
The fifth insight highlighted a critical gap in data filtration. ChatGPT misidentified our Partnership services page as an educational resource and, more importantly, failed to distinguish between user traffic and internal testing. When investigating further, over half of the sessions (43 total) originated from a 'localhost' environment during development. Because the AI didn't account for the referrer data it had access to, it treated developer activity as genuine user interest, leading to a highly skewed recommendation.
Super Sheet Strengths
I'll admit to some founder's bias, but seeing the Super Sheet's "So What Summary" side-by-side with ChatGPT was a defining moment. While ChatGPT provided a generic strategy, our "Top Insights" provided an actual roadmap for what works with the math to back it up. In this head-to-head comparison, the difference in depth and contextual accuracy wasn't just noticeable, it was undeniable.
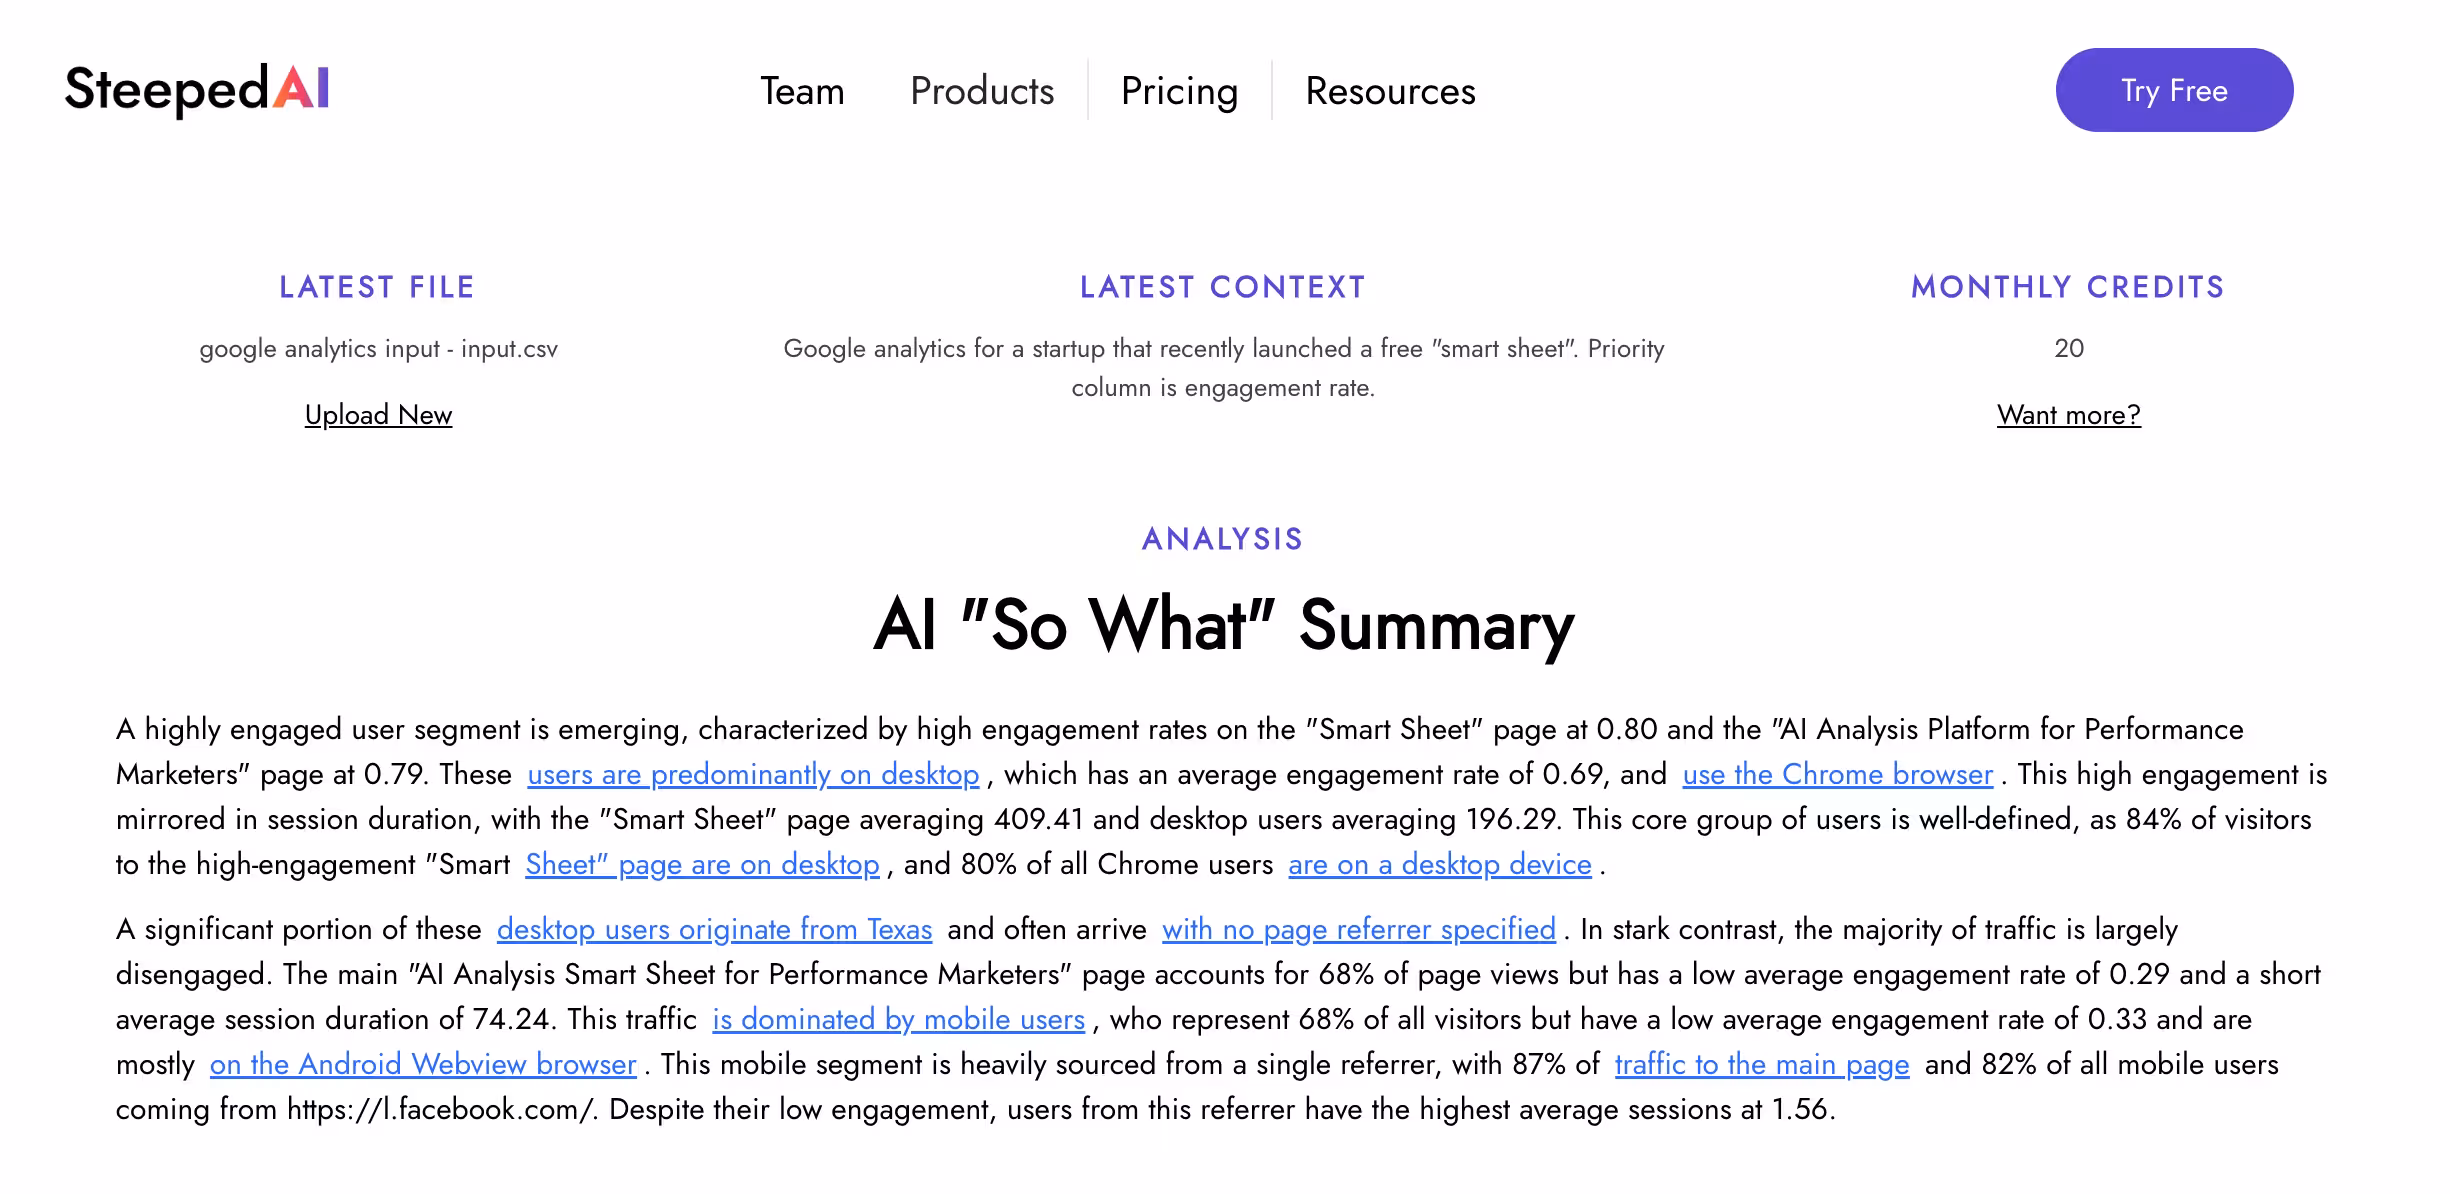
The "So What" Summary felt a lot more grounded in what was actually impactful and branched out into helpful context around that. It started off with the sentence "A highly engaged user segment is emerging, characterized by high engagement rates on the 'Smart Sheet' page at 0.80 and the 'AI Analysis Platform for Performance Marketers' page at 0.79." Both of those examples had a much higher total than 3 sessions because Steeped AI only surfaces those calculations to AI. It then zoomed into those insights with "These users are predominantly on desktop, which has an average engagement rate of 0.69, and use the Chrome browser. This high engagement is mirrored in session duration, with the 'Smart Sheet' page averaging 409.41 and desktop users averaging 196.29."
The defining difference? Steeped AI's "So What" Summary successfully captured the Meta Ads context that ChatGPT overlooked. By identifying that the majority of our landing page traffic originated from a paid campaign, Steeped AI provided a strategic analysis grounded in reality, rather than just surface-level metrics: "This traffic is dominated by mobile users, who represent 68% of all visitors but have a low average engagement rate of 0.33 and are mostly on the Android Webview browser. This mobile segment is heavily sourced from a single referrer, with 87% of traffic to the main page and 82% of all mobile users coming from https://l.facebook.com/".
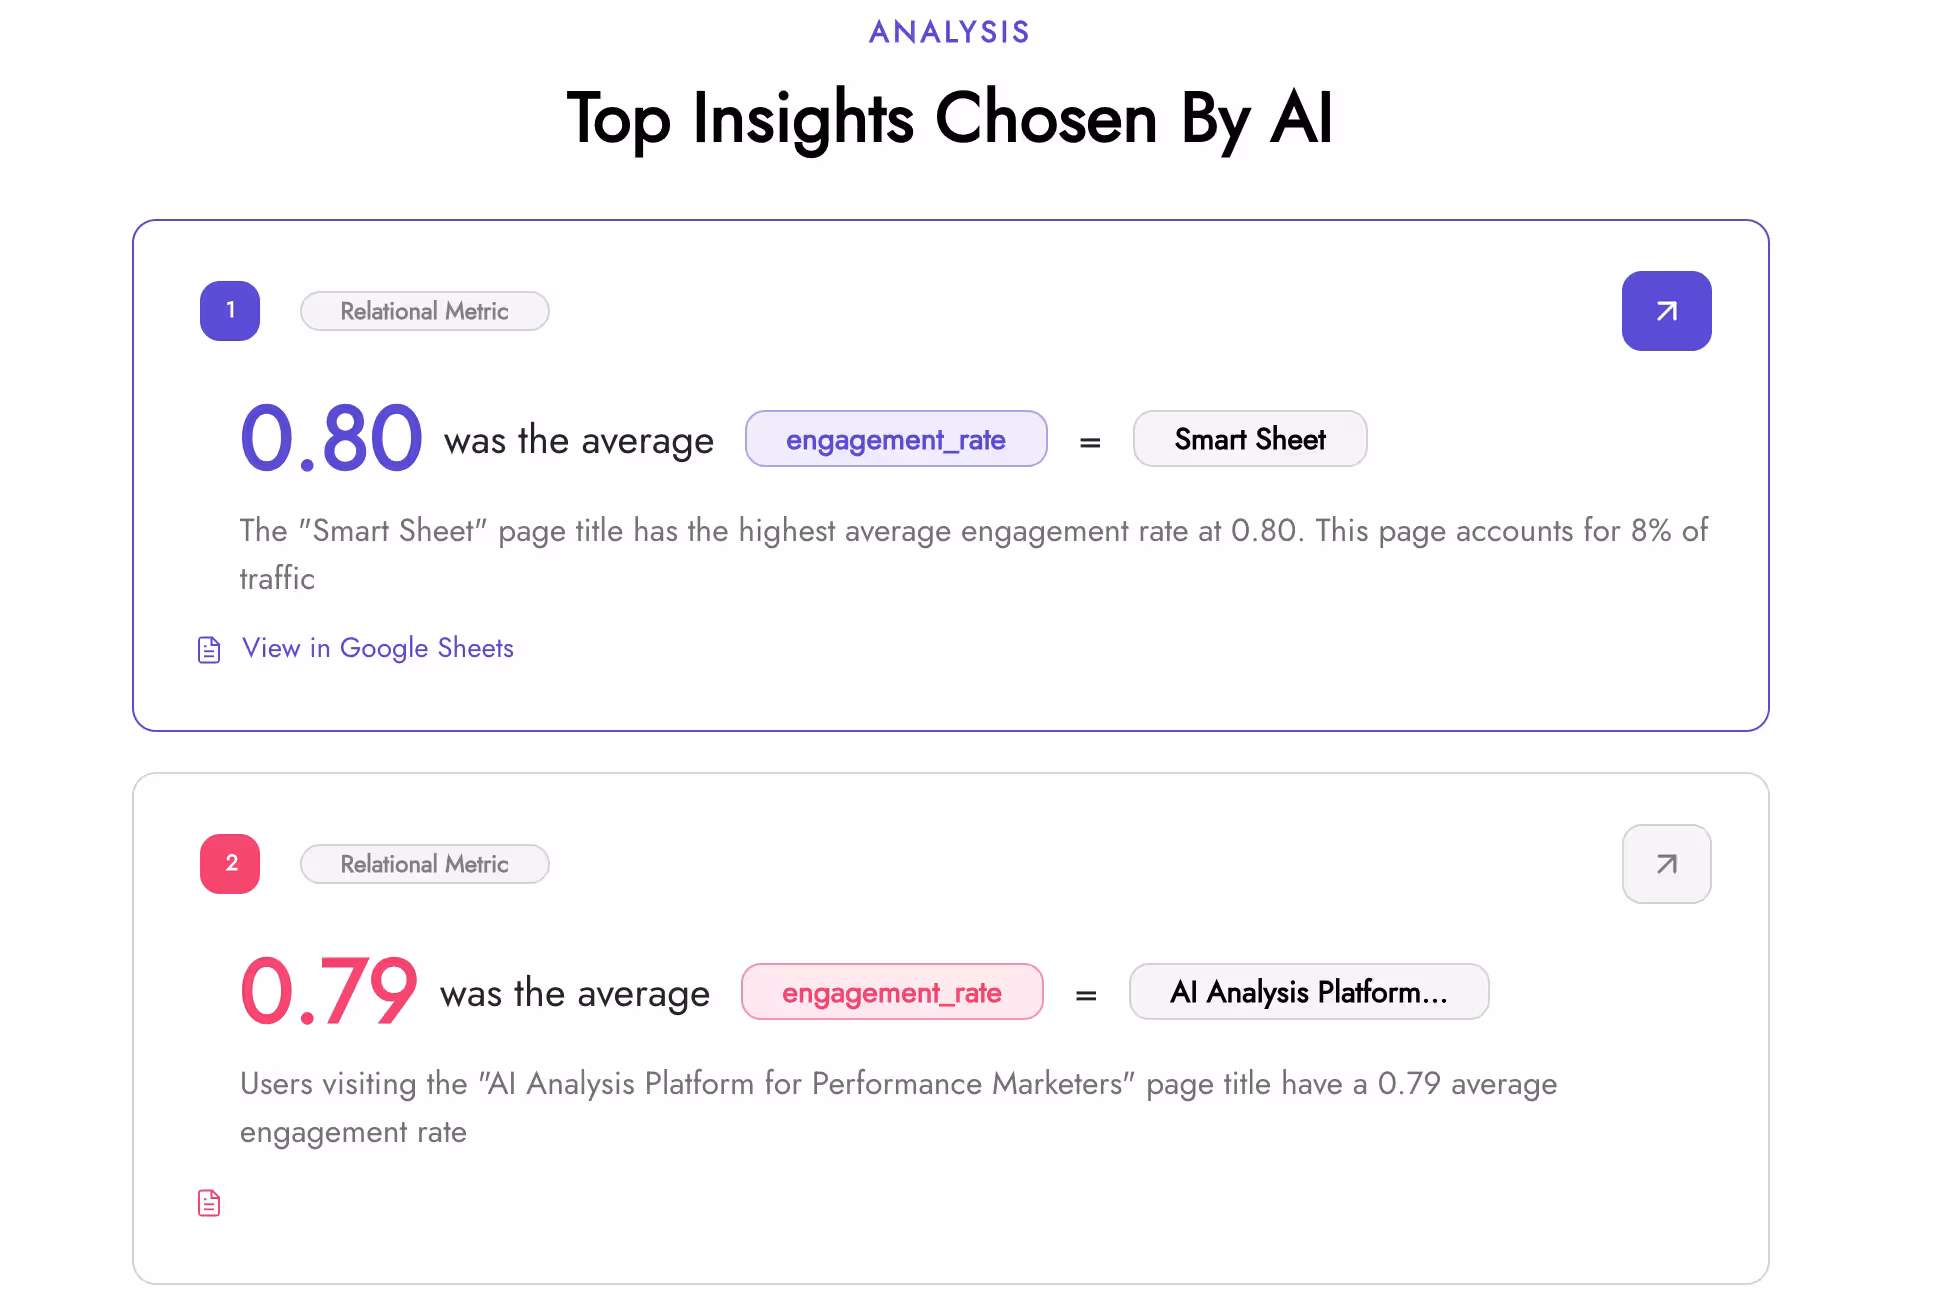
The next "Top Insights Chosen By AI" section is actually developed to be connected to the "So What" Summary and it shows. For example in the screenshot above, the top insight chosen by AI was "0.80 was the average engagement rate = Smart Sheet", which is also the first thing mentioned in the summary. The ability to skim the summary and then back it up with scrolling towards the actual insights is a nice flow. Beyond the data, we prioritized a clean, intuitive UI. The "More Insights" section is designed to make the metrics easy to digest at a glance. For those who want to go deeper, the connected Google Sheet includes a dedicated 'AI Report' tab, featuring 30-40 additional AI-curated insights for a comprehensive view of the entire dataset.
The Power of Insight Deep Links
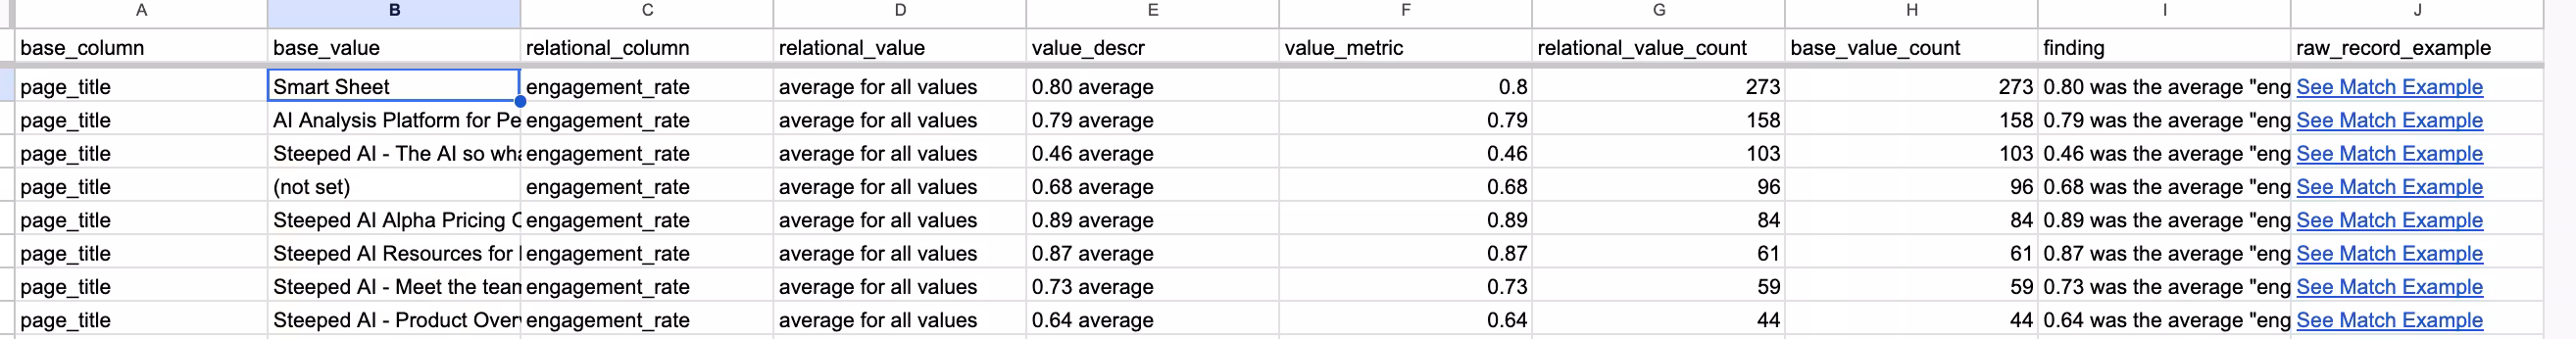
Throughout the summary there are "Insight Deep Links" hyperlinked within the text that allow you to go to the real, non-AI metric calculations with one click. With the Insight Deep Links always 1-2 clicks away from the raw calculations, suddenly AI goes from an end all, be all authoritative voice to a helpful signal you can investigate further with the facts. Take the "0.80 was the average engagement rate = Smart Sheet" insight example, when you click on that it takes you to the exact row in the sheet where the calculation is made with the raw math available. When you click "See Match Example" it then takes you to a row in the raw source that is for the “Smart Sheet” page for a complete sanity check.
At the heart of the Super Sheet are two core worksheets: Value Metrics and Relational Metrics. Unlike a standard AI chat, these calculations are deterministic, run the analysis 1,000 times and the numbers will never change. We've automated the tedious "crosstab" metrics usually reserved for dedicated research teams, allowing you to see relationships from multiple angles, For example, one Relational Metric from the set was "6% of Desktop records were from California" and it also has "22% of California records were Desktop. It feels great to skim and sort through the worksheets knowing I most likely won't be missing anything. Because these metrics are calculation-based rather than generative. They offer a reliable "single source of truth" that you can confidently share with your entire team for further exploration.
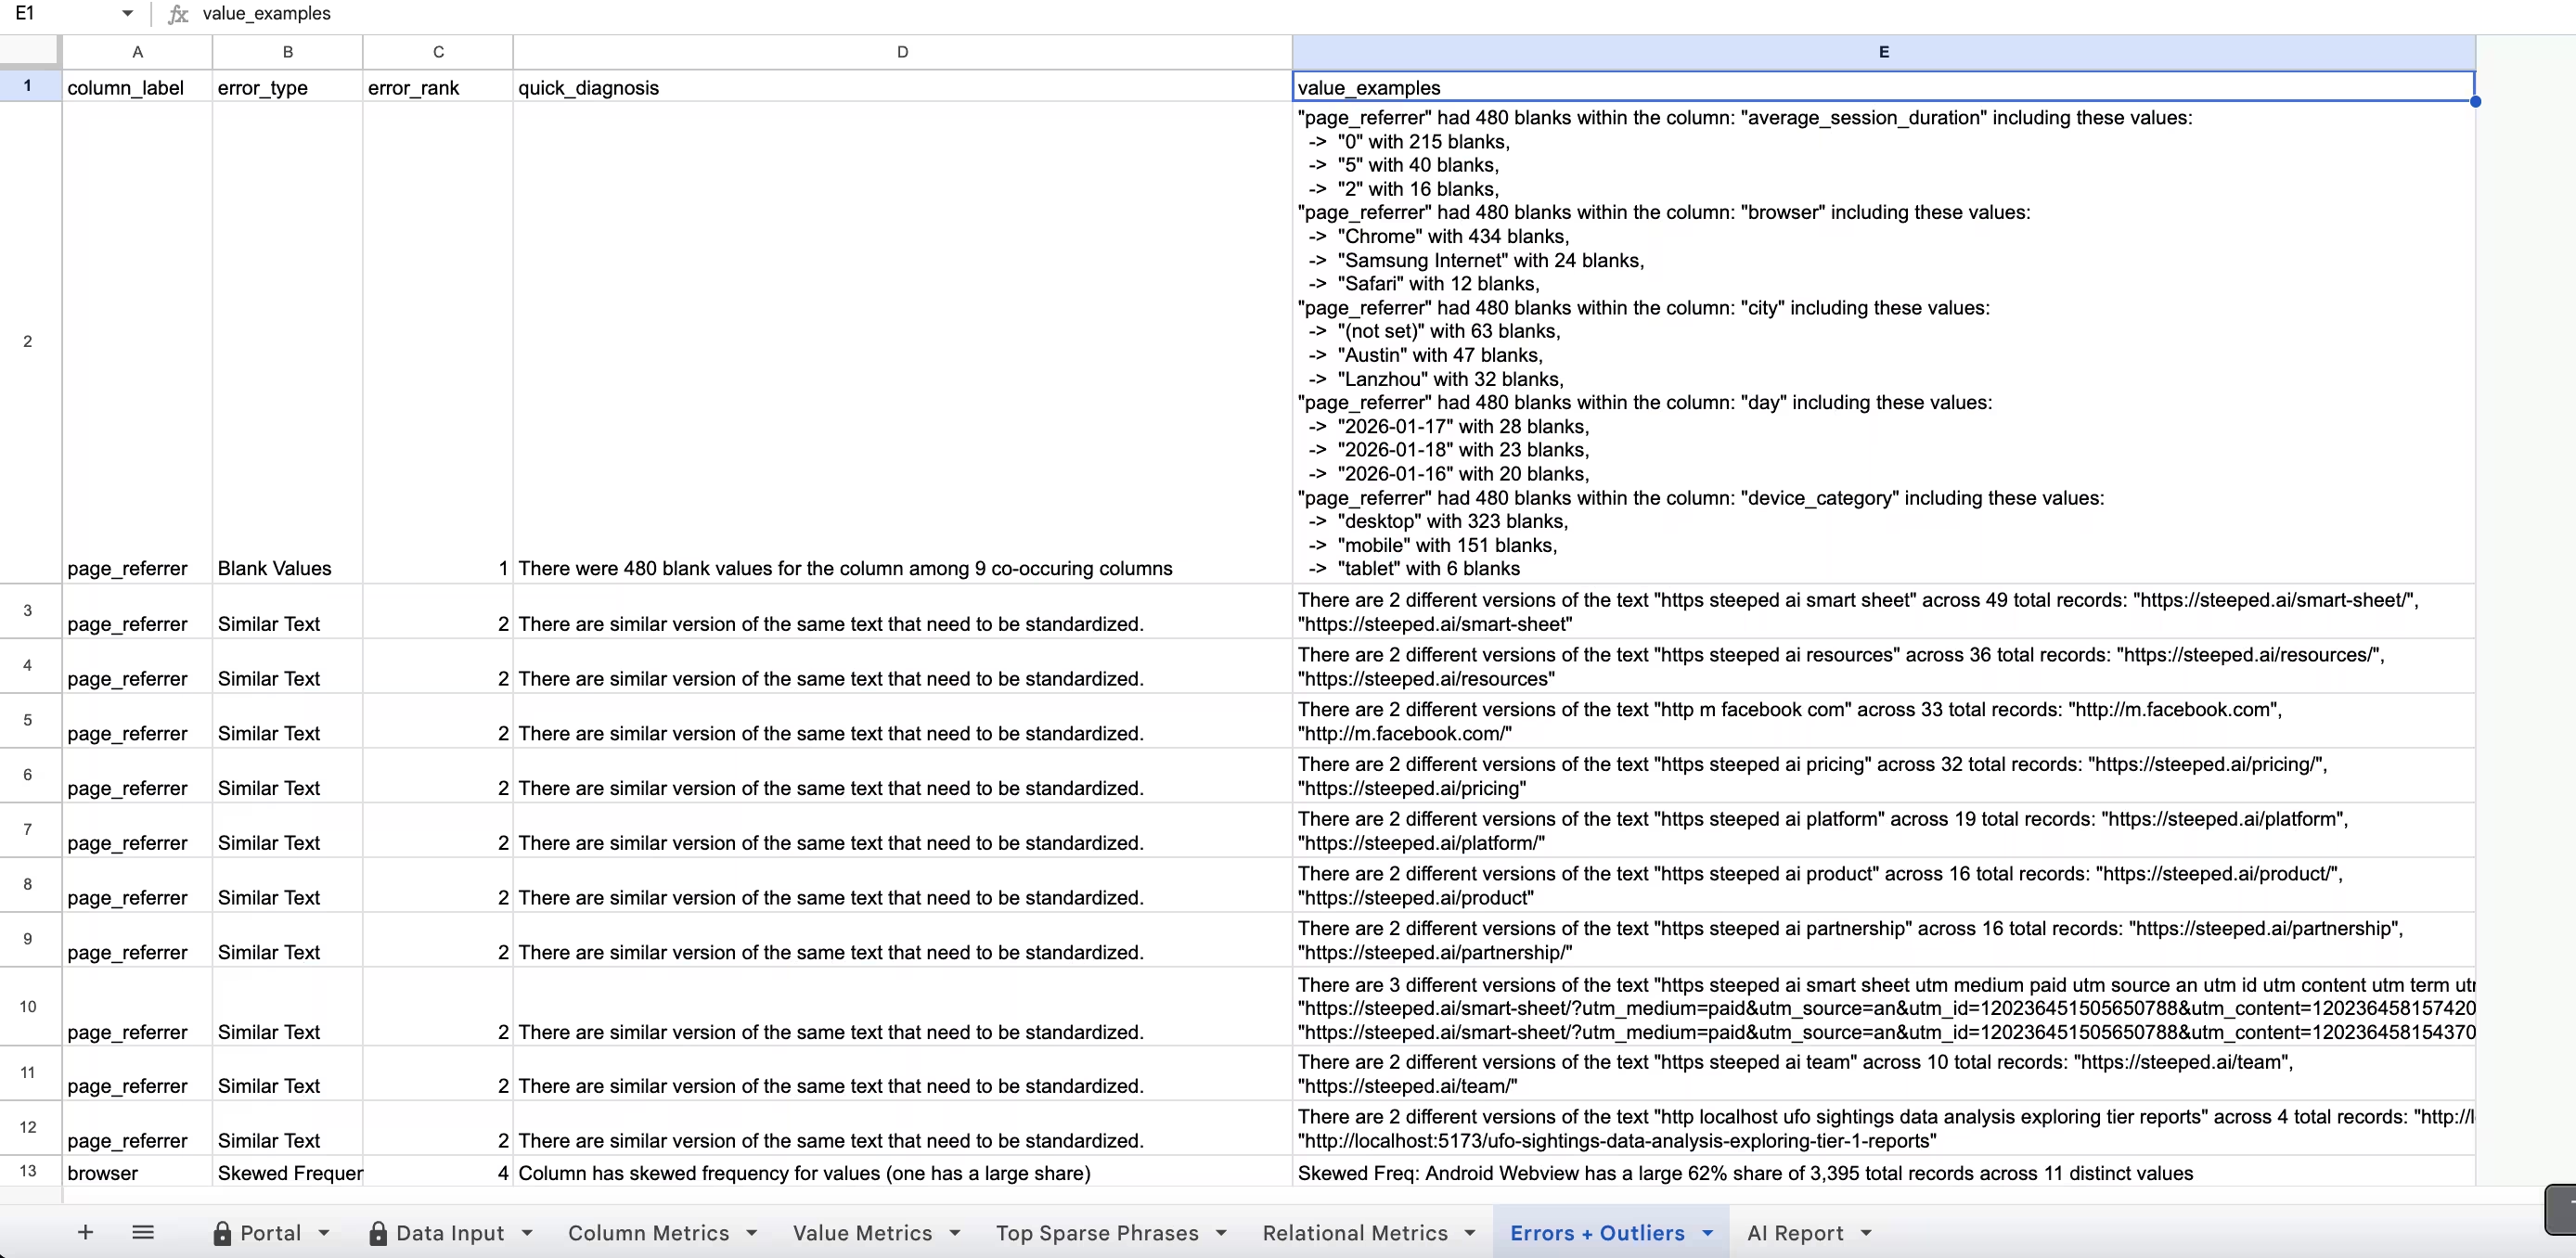
There are few hidden and charming features like automatically calculating month + year for any date data types to explore, and flagging possible outliers and errors in the data in the "Errors & Outliers" worksheet. For this dataset, it showed advanced statistics for outliers like skewed frequency and highlighted columns with the most blanks and what breakouts to explore to understand why they are blank.
Final Comparisons
While the Super Sheet offers deep analysis, it currently trails ChatGPT in processing speed. Total analysis time ranges from 2.5 to 3 minutes, with the primary bottleneck being the "insight summarization" phase, which accounts for roughly 2 minutes of the total duration. In contrast, the raw calculation layer remains competitive at approximately 30 seconds. To bridge this gap, Steeped AI is optimizing the Gemini API integration by refining prompt token counts and streamlining the calculation logic to significantly reduce overall latency.
ChatGPT is undeniably good at brainstorming. It treats every insight as an opportunity for action, often pulling in clever external context to suggest next steps. But herein lies the risk: an AI's enthusiasm for "next steps" doesn't always account for data significance. As we saw with the low-session pages, ChatGPT's recommendations can be strategically "noisy," leading teams to chase phantom trends that don't actually move the needle. While the Super Sheet hints at next steps through the summary and the Errors and Outliers sections, it doesn't yet provide clear recommended actions. This is feedback we've already heard from users, so adding actionable next steps is high on our development list.
ChatGPT can customize to any whim. AI Chatbots ability to understand user intent and instructions and act on it, has been one of the key factors for its massive impact. If I wanted the report to include more complex concepts like a SWOT or factor analysis, ChatGPT would win every time. Heck, if I wanted to make things more fun and make the report in the voice of Arnold Schwarzenegger, it would ace it. The ability to follow up with the initial prompt and ask follow up questions and ponderings is useful if you trust its analysis.
Conclusion
With data analysis, the extra context and nuance in the data not only is essential, it's kind of the whole point. Understanding the nuance is where the Super Sheet thrived because it actually shows its work in the Google Sheet and actively encourages you to explore it with Insight Deeplinks. However, uploading the data to ChatGPT definitely has its perks as well, namely the ability to customize the analysis and chat with it. My suggestion would be to start with the Super Sheet with your data upload first to get the "So What" and then upload it to ChatGPT to ask questions about it about the main results. Then you can back up anything ChatGPT says with the actual calculations from Steeped AI. Additionally, browsing the Super Sheet calculation worksheets will make sure you aren't leaving anything essential behind in your analysis.
In the interest of transparency, here's the full comparison information on the same upload data, so you can judge it yourself:
- Google Analytics Input Data
- Screenshot folder of our Super Sheet exploration (the dynamic actual full UI and Google Sheet are hidden and restricted for user data privacy)
- Google Analytics Input Data
If you want to give the Super Sheet a try for yourself, try it out for free here.